
| Loudspeaker Measurements |
|
Excelsior Audio features a lab specifically for loudspeaker measurements. Our focus is on performing directivity balloon, sensitivity, maximum input voltage, and other measurements to characterize loudspeaker system performance. |
||||||||
| Frequency Response / Impulse Response | ||||||||
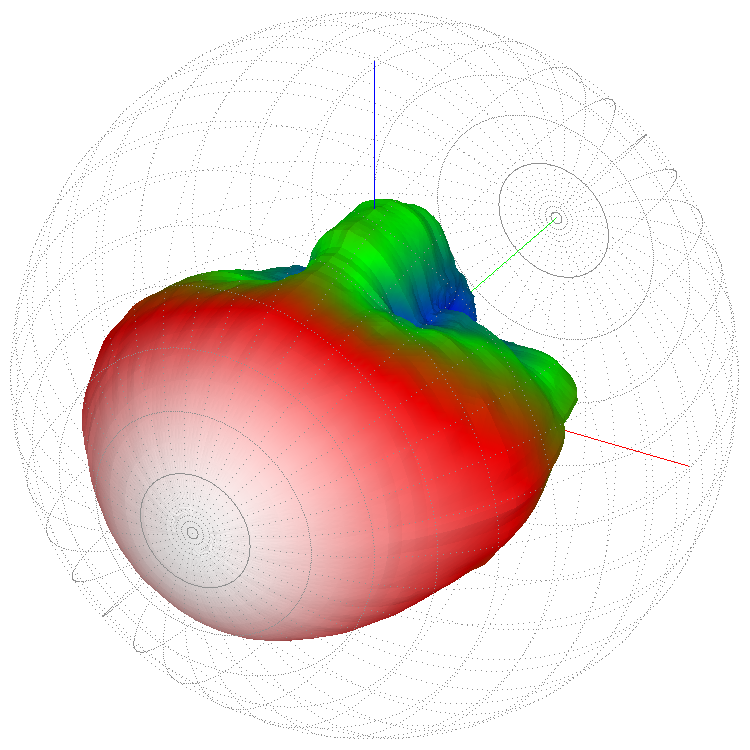
| The impulse response (IR) measurement is one of the most often measured characteristics of a loudspeaker. It is the time domain equivalent of the transfer function, often called the frequency response. The IR contains both magnitude and phase information (complex data). The on-axis IR can be used to determine the sensitivity of the loudspeaker. IR measurements at off-axis positions can be assembled to form the directivity balloon for a loudspeaker. | ||||||||
|
||||||||
| FIR Filter Development | ||||||||
| Both on-axis and off-axis impulse response measurements can be used to develop FIR filters to help linearize the phase response and improve the transient response of loudspeaker systems. | ||||||||
| Directivity Response (Directivity Balloon) | ||||||||
|
||||||||
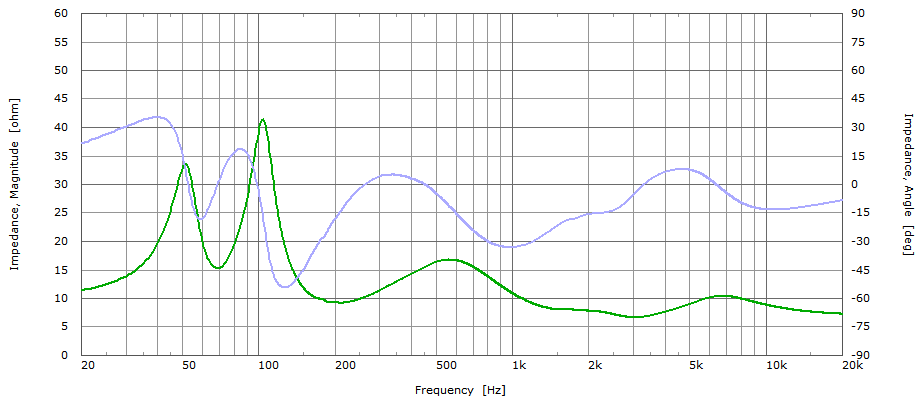
| Impedance Measurements | ||||||||
| Impedance measurements are used to determine the rated impedance of a loudspeaker system per industry standards. Impedance measurements can be complex, containing both magnitude and phase angle information. | ||||||||
|
||||||||
| Maximum Input Voltage Measurements | ||||||||
| The maximum input voltage (MIV) of loudspeakers is determined according to industry standards. Maximum SPL calculations in modeling programs based on MIV correlate well with real world measurements of deployed systems. The MIV data can also be used to adjust limiter settings so that loudspeakers can reach maximum SPL while still sounding good and not being damaged. | ||||||||
.png)
|
||||||||
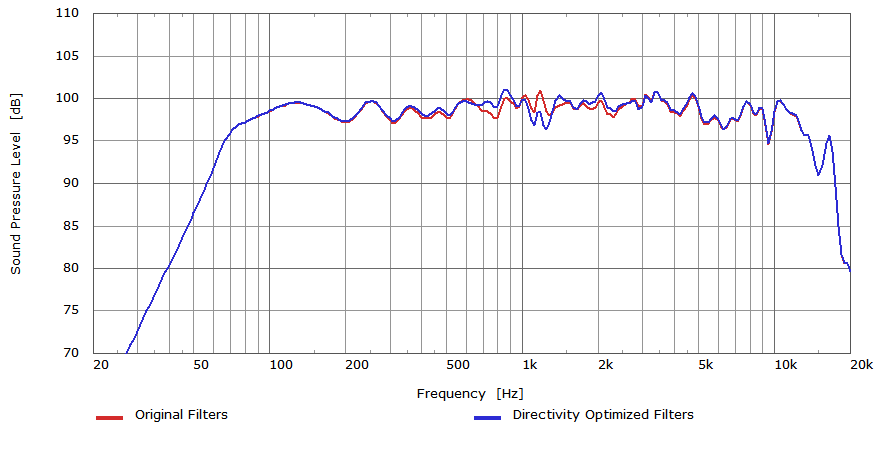
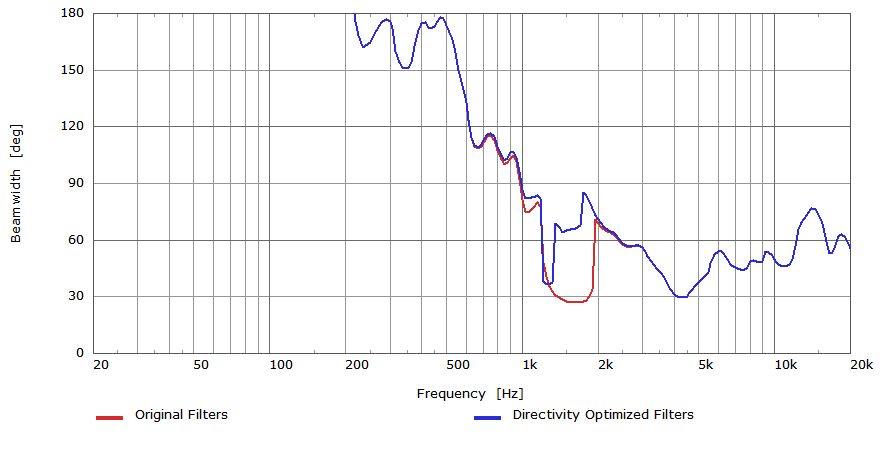
| Crossover Design and Optimization | ||||||||
|
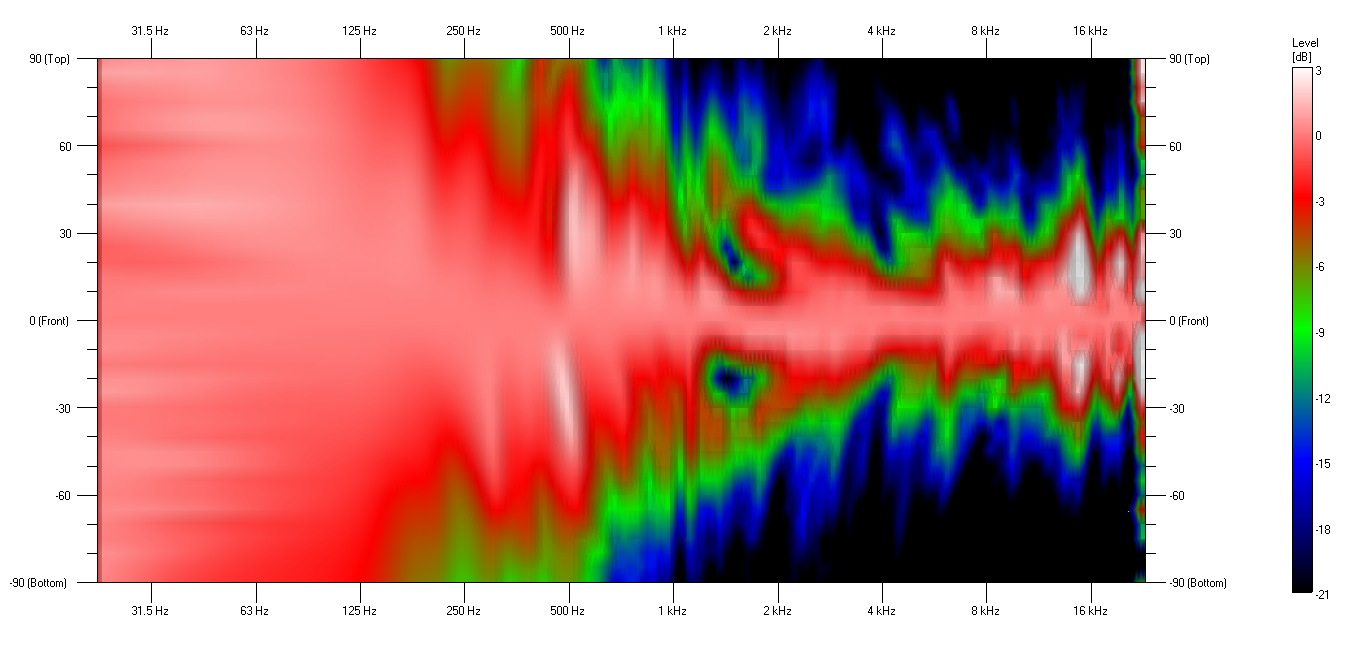
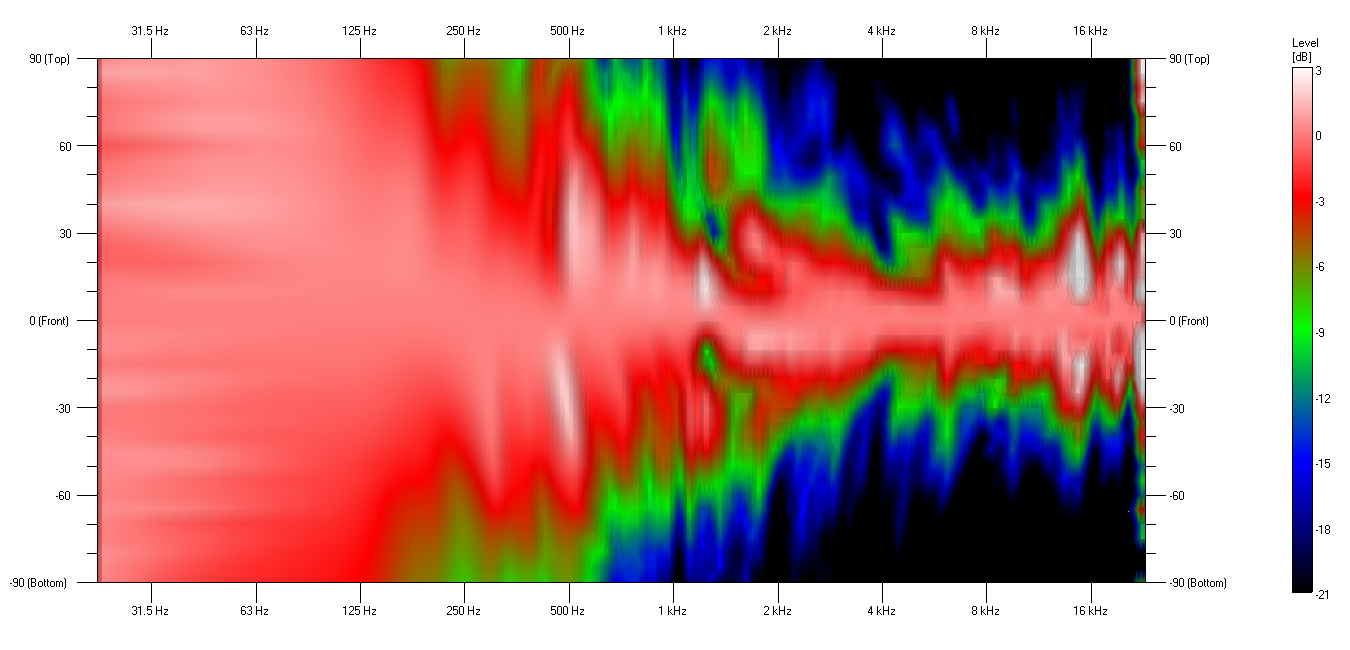
Directivity-optimizated crossover designs use the directivity balloons of the individual pass band (e.g. LF, MF, and HF) to investigate the
directivity of the loudspeaker system through the crossover region(s). The crossover design is optimized for good off-axis response
in the crossover region(s) without having to re-measure the loudspeaker.
The graphs below show a comparison of the response, before and after the optimization process, for a two-way loudspeaker comprised of a 15 inch woofer and a high frequency horn. The result of the optimization is much more consistent vertical directivity through the crossover region from 1 kHz to 2 kHz. The on-axis response remains virtually unchanged. |
||||||||
|
||||||||
.png)
.png)
| Excelsior Audio Labs |