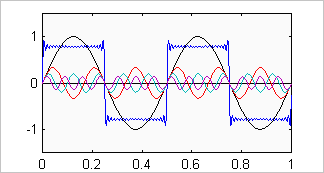
A Brief Explanation of PhaseTo demonstrate what phase really is let's first examine a system with ideal phase response passing a square wave. Look at this with the principle of superposition in mind. The square wave is actually the sum of decreasing amounts of the odd harmonics of the fundamental. All of these harmonics are in phase with the fundamental (and with each other). To demonstrate this let's pick a reference point, say the positive going zero crossing of the fundamental as viewed in the time domain (an oscilloscope trace). All of these harmonics will also have a positive going zero crossing at this reference point in the cycle of the fundamental.
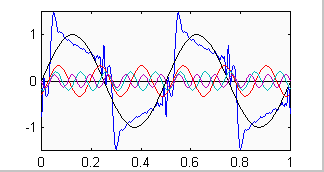
If phase distortion is introduced by a system with non-ideal phase response, all of the harmonics are no longer in phase with the fundamental. In other words, at the fundamentals positive going zero crossing some of the harmonics will no longer be at their positive going zero crossing. As an example, given a 1 kHz square wave, if there is -90 degrees of phase shift at 5 kHz (relative to 1 kHz) then the 5th harmonic that makes up the square wave will have a minima, not a positive going zero crossing, at the reference point in the cycle of the fundamental.
Let's now turn our attention to the frequency domain. Looking at a TEF/Smaart plot of phase vs. freq. for our system with ideal phase response, after having removed any excess delay, we would see a straight horizontal line. This would be indicating to us that all frequencies have 0 degrees phase shift relative to each other. If we now examine the system with non-ideal phase response, say a loudspeaker, we would see a curve that starts out at X degrees at some low frequency. As frequency increases the overall trend of the curve is one of decreasing phase. At 1 kHz the phase curve may indicate -50 degrees while at 5 kHz it indicates -140 degrees, in keeping with our example above. An important point to keep in mind is that the 0 degrees phase line on a TEF/Smaart plot and the zero crossing on a oscilloscope trace are not necessarily the same thing. Also note that the setting for the receive delay on the TEF/Smaart to remove the excess delay has only one value for a given measurement. Any "tweaking" of this value results in one of two consequences:
The latter is indicative of an acausal system in which energy comes out before it is put in. Both of these conditions can allow for 0 degrees phase at a given frequency on the curve. |
|
|
| Excelsior Audio Labs |

